Sep 08

Demystifying Kubernetes Components – Understanding the Core of K8s

Kubernetes, often abbreviated as K8s, has taken the container orchestration world by storm. To harness the true power of K8s, one must have a solid grasp of its core components. In this comprehensive guide, we’ll embark on a journey to explore Kubernetes components, demystifying the intricacies of this powerful container orchestration platform.

Unveiling Kubernetes Components

Kubernetes operates as a distributed system, comprising various essential components, each playing a unique role in managing containerized applications. Let’s dive deep into the heart of K8s:

Master Node Components:

  1. Kubernetes API Server:
    • At the nucleus of K8s lies the Kubernetes API server. This component acts as the gateway to the cluster, providing a unified point of entry for users and other Kubernetes components. All interactions with the cluster, from creating pods to scaling applications, are orchestrated through this vital component.
  2. Controller Manager:
    • The Controller Manager is the guardian of the desired cluster state. It continually monitors the system, detecting deviations from the desired state, and takes corrective actions to align the cluster with predefined configurations. Scaling applications, managing replication, and maintaining resource quotas are among its crucial responsibilities.
  3. Scheduler:
    • The Scheduler is the matchmaker of the Kubernetes world. It decides where newly created pods should be placed within the cluster based on factors like resource availability, constraints, and affinity rules. This ensures optimal resource utilization and high availability.
  4. etcd:
    • etcd serves as the distributed key-value store that acts as Kubernetes’ memory. It stores all configuration data, cluster state, and critical information required for the cluster’s operation. Without etcd, the integrity and reliability of the cluster would be compromised.

Worker Node Components:

  1. Kubelet:
    • Kubelet is the watchful guardian of each worker node in the cluster. It communicates with the master node’s API server, ensuring that containers (pods) on its node are running as expected. It also handles tasks such as container creation, resource monitoring, and garbage collection.
  2. Kube Proxy:
    • Kube Proxy is responsible for maintaining network rules on nodes, facilitating network communication within the cluster. It enables pod-to-pod communication, load balancing, and ensures that services are accessible both internally and externally.
  3. Container Runtime:
    • The Container Runtime, which can be Docker or containerd, is responsible for executing containers. Kubernetes abstracts this layer, providing a consistent interface for managing containers, regardless of the underlying runtime.

Add-Ons and Optional Components:

  1. Kubernetes Dashboard: A Visual Control Center
  2. DNS in Kubernetes: Seamless Service Discovery
  3. Ingress Controller: Managing External Access
  4. Network Plugin (CNI): Linking Your Pods

Conclusion :

In this comprehensive exploration of Kubernetes components, we’ve peeled back the layers of K8s to reveal its inner workings. Understanding these components is not just valuable; it’s paramount for those seeking to leverage the full potential of Kubernetes in orchestrating containerized applications. As you continue your journey in the realm of K8s, delve deeper into each component, experiment, and gain hands-on experience. Soon, you’ll emerge as a Kubernetes expert, equipped to tackle even the most complex container orchestration challenges with confidence.

Nov 14

How to pause and resume rsync

Just like any other Linux process, you can pause rsync by sending it a TSTP (polite) or STOP (forcible) signal. On the terminal you’ve run rsync in, pressing Ctrl+Z sends TSTP. Resume with the fg or bg command in the terminal or a CONT signal. To resume the rsync where it is interrupted, make sure to pass -P, otherwise rsync will check all files again and process the file it was interrupted on from scratch.

Ex:-

01) execute rsync command with “-P”


more about “-P” option from man page of rsync :

-P
The -P option is equivalent to –partial –progress. Its purpose is to make it much easier to specify these two options for a long transfer that may be interrupted.

There is also a –info=progress2 option that outputs statistics based on the whole transfer, rather than individual files. Use this flag without outputting a filename (e.g. avoid -v or specify –info=name0) if you want to see how the transfer is doing without scrolling the screen with a lot of names. (You don’t need to specify the –progress option in order to use –info=progress2.)

Finally, you can get an instant progress report by sending rsync a signal of either SIGINFO or SIGVTALRM. On BSD systems, a SIGINFO is generated by typing a Ctrl+T (Linux doesn’t currently support a SIGINFO signal). When the client-side process receives one of those signals, it sets a flag to output a single progress report which is output when the current file transfer finishes (so it may take a little time if a big file is being handled when the signal arrives). A filename is output (if needed) followed by the –info=progress2 format of progress info. If you don’t know which of the 3 rsync processes is the client process, it’s OK to signal all of them (since the non-client processes ignore the signal).

CAUTION: sending SIGVTALRM to an older rsync (pre-3.2.0) will kill it.


02) pause rsync

Press Ctrl+Z to stop the process.


If you kill rsync with Ctrl+C it does stop it mid transfer but it will not keep any temporary files there unless running with the –partial option.

For those also interested in just pausing rsync, if you press Ctrl+Z it pauses the program. When you resume it by running fg or bg rsync will reiterate over the file that it didn’t finish and continue downloading the rest of the files. To see all currently paused programs run jobs

03) To view the jobs


so job id is “1”

04) resume rsync process

to resume the job, you may need to pass jobs id as fg command.


The general job control commands in Linux are:


  • jobs – list the current jobs
    fg – resume the job that’s next in the queue
    fg %[number] – resume job [number]
    bg – Push the next job in the queue into the background
    bg %[number] – Push the job [number] into the background
    kill %[number] – Kill the job numbered [number]
    kill -[signal] %[number] – Send the signal [signal] to job number [number]
    disown %[number] – disown the process(no more terminal will be owner), so command will be alive even after closing the terminal. Read the rest of this entry »

Dec 25

AWS CloudWatch Apache HTTP monitoring

AWS CloudWatch provides custom metric monitoring. It is very useful when require to monitor performance of the custom application or server. Here we are going to guide how monitor Apache HTTP server performance using AWS CloudWatch custom metrics. All the installation and configuration performed on CentOS, most of the commands work on any LINUX / UNIX like system. If you need more details, you may can visit official documentation. I always try to attach official docs where it is possible.

1) Install aws cli


You can find details guidelines from official documents

Once the installation is completed, you can verify installed version using following command.

2) Create IAM user with “Programmatic access” and assign following policy to the user.


please note down “access key ID and secret access key” which is needed on next step.

3) Configure AWS client


execute following command as root user. you must enter Key ID and secret key. you should enter region name where your EC2 instance is running.
please refer this link to obtain your region name code
you can keep output format as none.

4) Create simple shell script to push data into AWS Cloudwatch


you may can replace localhost with your EC2 instance private IP. Here we are interested to push Busy Workers,Idle worker and Connection Total data to CloudWatch, but there are few other metrics are available on server status page . you can get full list of metrics by visiting http://<your server IP>/server-status?auto


5) Set cron job to push data

setup cronjob to execute above shell script to run every 5 minutes

6) How to view AWS CloudWatch custom metrics

i) Go to AWS CloudWatch

ii) Then select Metrics menu from left hand side bottom.

iii) Select “All metrics” tab , and you can see “EC2:HTTP-Apache” under Custom Namespaces

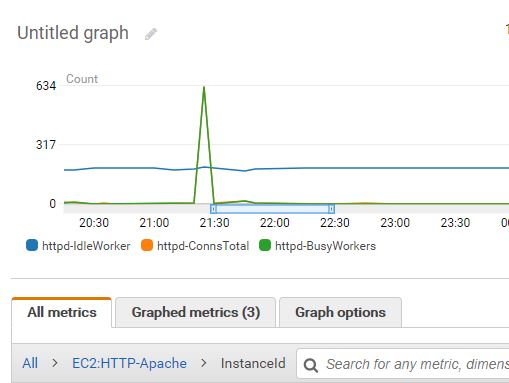
iv) Example output of the graph is as follows.(you should send data frequently to CloudWatch to generate useful graph)


AWS CloudWatch custom metrics raph

Older posts «

» Newer posts

Fetch more items