AWS CloudWatch provides custom metric monitoring. It is very useful when require to monitor performance of the custom application or server. Here we are going to guide how monitor Apache HTTP server performance using AWS CloudWatch custom metrics. All the installation and configuration performed on CentOS, most of the commands work on any LINUX / UNIX like system. If you need more details, you may can visit official documentation. I always try to attach official docs where it is possible.
1) Install aws cli
|
1 |
[root@localhost centos]#pip install awscli |
You can find details guidelines from official documents
Once the installation is completed, you can verify installed version using following command.
|
1 2 |
[root@localhost centos]# aws --version aws-cli/1.14.11 Python/2.7.5 Linux/3.10.0-693.el7.x86_64 botocore/1.8.15 |
2) Create IAM user with “Programmatic access” and assign following policy to the user.
please note down “access key ID and secret access key” which is needed on next step.
|
1 2 3 4 5 6 7 8 9 10 11 12 13 14 15 16 17 |
{ "Version": "2012-10-17", "Statement": [ { "Effect": "Allow", "Action": [ "logs:CreateLogGroup", "logs:CreateLogStream", "logs:PutLogEvents", "logs:DescribeLogStreams" ], "Resource": [ "arn:aws:logs:*:*:*" ] } ] } |
3) Configure AWS client
execute following command as root user. you must enter Key ID and secret key. you should enter region name where your EC2 instance is running.
please refer this link to obtain your region name code
you can keep output format as none.
|
1 2 3 4 5 |
[root@localhost centos]# aws configure AWS Access Key ID [None]: AWS Secret Access Key [None]: Default region name [None]: Default output format [None]: |
4) Create simple shell script to push data into AWS Cloudwatch
you may can replace localhost with your EC2 instance private IP. Here we are interested to push Busy Workers,Idle worker and Connection Total data to CloudWatch, but there are few other metrics are available on server status page . you can get full list of metrics by visiting http://<your server IP>/server-status?auto
|
1 2 3 4 5 6 7 8 9 10 11 12 13 14 15 |
#!/bin/bash INSTANCE_ID=`wget -q -O - http://169.254.169.254/latest/meta-data/instance-id` # In our next two Variable we are saving our Busy and Idle workers BUSYWORKERS=`wget -q -O - http://localhost/server-status?auto | grep BusyWorkers | awk '{ print $2 }'` IDLEWORKERS=`wget -q -O - http://localhost/server-status?auto | grep IdleWorkers | awk '{ print $2 }'` CONNSTOTAL=`wget -q -O - http://localhost/server-status?auto | grep ConnsTotal | awk '{ print $2 }'` # Push Busy Workers,Idle worker and Connection Total data to Cloud Watch /bin/aws cloudwatch put-metric-data --metric-name "httpd-BusyWorkers" --unit Count --value ${BUSYWORKERS} --dimensions InstanceId=$INSTANCE_ID --namespace EC2:HTTP-Apache /bin/aws cloudwatch put-metric-data --metric-name "httpd-IdleWorker" --unit Count --value $IDLEWORKERS --dimensions InstanceId=$INSTANCE_ID --namespace EC2:HTTP-Apache /bin/aws cloudwatch put-metric-data --metric-name "httpd-ConnsTotal" --unit Count --value $CONNSTOTAL --dimensions InstanceId=$INSTANCE_ID --namespace EC2:HTTP-Apache |
5) Set cron job to push data
setup cronjob to execute above shell script to run every 5 minutes
|
1 |
*/5 * * * * /opt/scripts/apachemonitor/apachestats.sh |
6) How to view AWS CloudWatch custom metrics
i) Go to AWS CloudWatch
ii) Then select Metrics menu from left hand side bottom.
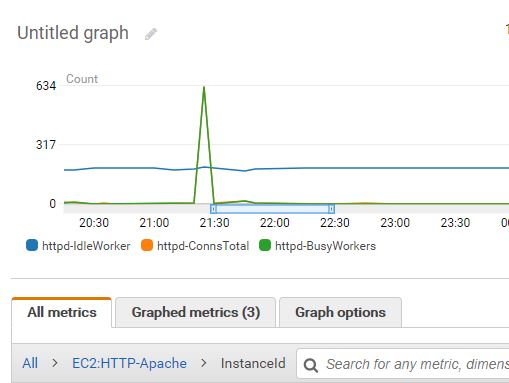
iii) Select “All metrics” tab , and you can see “EC2:HTTP-Apache” under Custom Namespaces
iv) Example output of the graph is as follows.(you should send data frequently to CloudWatch to generate useful graph)


